Structural lesion network mapping
In this tutorial, you will explore the structural network mapping functionalities of Lacuna.
What you'll learn:
- Fetch a structural connectome
- Obtain voxel-level disconnectivity maps
- Compute a disconnectivity matrix
- Compute ROI-wise disconnection values
![]()
Setup
Get the tutorial data.
!lacuna tutorial /tmp/tutorial_bids --force
Check whether mrtrix3 is properly installed as it is required for the analysis.
!mrinfo --version
Fetch structural connectome
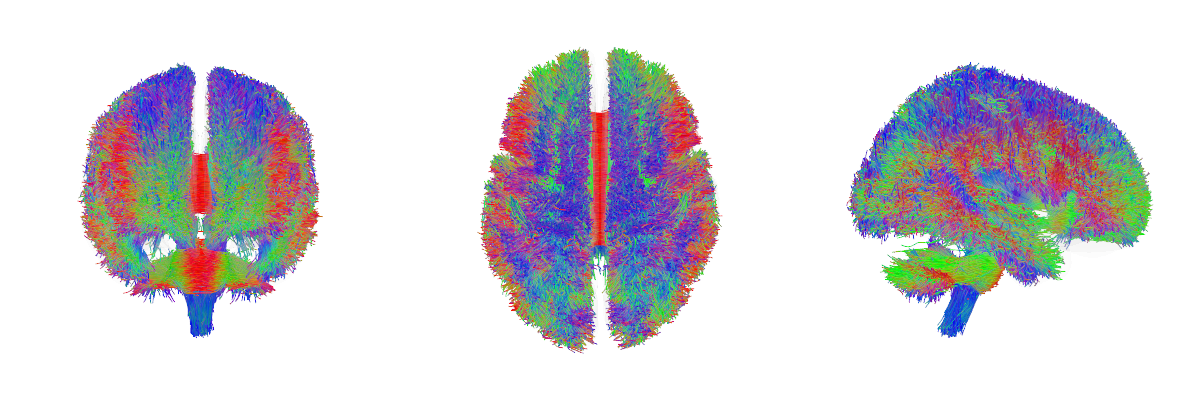
Structural network mapping requires a structural connectome in the form of a normative tractogram, i.e., a whole-brain reconstruction of white matter fiber pathways derived from diffusion-weighted MRI.
The main consideration when selecting a connectome is the trade-off between sensitivity and anatomical specificity.
Whenever possible, we recommend using dTOR985), as its extensive coverage maximizes sensitivity. This connectome was generated using an untargeted whole-brain tractography approach and contains approximately 11 million streamlines Downloading the full tractogram requires a personal Figshare API token. You can obtain one by logging into Figshare and navigating to Account → Integrations → Personal Tokens.
dTOR985 normative tractogram
For demonstration purposes, this tutorial uses a lightweight 10% random subsample of dTOR985, which can be downloaded without an API token and requires substantially fewer computational resources.
As an alternative, we can fetch the HCP1065 tractogram, which consists of a curated set of white matter bundles. It was generated using trajectory-based bundle recognition against an expert-vetted atlas, followed by topology-informed pruning to remove anatomically implausible connections. This results in higher anatomical specificity and makes HCP1065 well suited for analyses where minimizing false-positive streamlines is a priority. However, its more conservative reconstruction yields lower coverage and, consequently, reduced sensitivity.
!lacuna fetch dtor985_10pct \
    --output-dir /tmp/dtor985_10pct_data
Analysis
By filtering the normative tractogram based on the mask image, structural network mapping identifies white matter fiber bundles connected to a specific lesion. By that, we can infer which pathways have been disconnected or disrupted.
What the structural network mapping implementation internally does:
- Ensure spatial alignment
- Compute the voxel-level tract density image (TDI) of full tractogram (amount of streamlines per voxel)
- Filter the normative tractogram by the lesion mask
- Compute the TDI of the lesion filtered tractogram and divide the lesion TDI by the original TDI to obtain a disconnection map (% of streamlines connected to the lesion).

Structural network mapping procedure shown with exemplary lesion.
Now run the analysis.
!lacuna run snm \
    /tmp/tutorial_bids/ \
    /tmp/outputs_snm_run1/ \
    --connectome-path /tmp/dtor985_10pct_data/dtor985_10pct.tck \
    --participant-label 01 \
    --mask-space MNI152NLin6Asym
The standard run as shown above produces voxel-level disconnectivity maps.
!ls /tmp/outputs_snm_run1/sub-01/ses-01/anat/
sub-01_ses-01_label-acuteinfarct_method-snm_desc-summarystatistics_stats.json
sub-01_ses-01_label-acuteinfarct_method-snm_space-MNI152NLin6Asym_desc-disconnectionpct.json
sub-01_ses-01_label-acuteinfarct_method-snm_space-MNI152NLin6Asym_desc-disconnectionpct.nii.gz
Visualize the output.
import nibabel as nib
from nilearn import plotting

disconnection_path = '/tmp/outputs_snm_run1/sub-01/ses-01/anat/sub-01_ses-01_label-acuteinfarct_method-snm_space-MNI152NLin6Asym_desc-disconnectionpct.nii.gz'
disconnection_img = nib.load(disconnection_path)

disconnection_map = plotting.plot_stat_map(disconnection_img,
                       radiological=True,
                       title="Disconnection map from SNM \n(% of streamlines connecting to the lesion)",
                       draw_cross=False,
                       colorbar=True,
                       dim=-0.2,
                       cmap='Reds')

Obtain parcel-level disconnectivity scores and disconnectivity matrix
Beyond voxel-level maps, Lacuna covers two further formats of disconnectivity information: region of interest-level disconnectivity scores and a disconnectivity matrix.
These require the --compute-roi-disconnection flag as well as definition of a parcellation atlas via --parcel-atlases.
Run the analysis again with these flags.
!lacuna run snm \
    /tmp/tutorial_bids/ \
    /tmp/outputs_snm_run2/ \
    --connectome-path /tmp/dtor985_10pct_data/dtor985_10pct.tck \
    --participant-label 01 \
    --mask-space MNI152NLin6Asym \
    --compute-disconnectivity-matrix \
    --compute-roi-disconnection \
    --parcel-atlases schaefer2018parcels100networks7
2026-06-12 11:49:49 - lacuna.cli.main - ERROR - Failed to process sub-01: Output for sub-01_ses-01 already exists (e.g. /tmp/outputs_snm_run2/sub-01/ses-01/anat/method-snm_space-MNI152NLin6Asym_desc-disconnectionpct (voxelmap)); nothing new to write. Use overwrite=True to regenerate.
2026-06-12 11:49:49 - lacuna.cli.main - WARNING - Subject processing failed, continuing...
Matrix outputs comprise four complementary connectivity representations:
- Disconnectivity matrix – percentage of streamlines disconnected by the lesion
- Mask connectivity matrix – number of streamlines traversing the lesion mask
- Intact connectivity matrix – number of remaining streamlines after excluding those passing through the lesion (i.e., total minus mask connectivity)
- Full connectome matrix – total number of streamlines irrespective of lesion involvement
!ls /tmp/outputs_snm_run2/sub-01/ses-01/anat/*matrix*
/tmp/outputs_snm_run2/sub-01/ses-01/anat/sub-01_ses-01_label-acuteinfarct_method-snm_atlas-schaefer2018parcels100networks7_desc-disconnectionpct_connmatrix.json
/tmp/outputs_snm_run2/sub-01/ses-01/anat/sub-01_ses-01_label-acuteinfarct_method-snm_atlas-schaefer2018parcels100networks7_desc-disconnectionpct_connmatrix.tsv
/tmp/outputs_snm_run2/sub-01/ses-01/anat/sub-01_ses-01_label-acuteinfarct_method-snm_atlas-schaefer2018parcels100networks7_desc-fullconnectivitymatrix_connmatrix.json
/tmp/outputs_snm_run2/sub-01/ses-01/anat/sub-01_ses-01_label-acuteinfarct_method-snm_atlas-schaefer2018parcels100networks7_desc-fullconnectivitymatrix_connmatrix.tsv
/tmp/outputs_snm_run2/sub-01/ses-01/anat/sub-01_ses-01_label-acuteinfarct_method-snm_atlas-schaefer2018parcels100networks7_desc-intactconnectivitymatrix_connmatrix.json
/tmp/outputs_snm_run2/sub-01/ses-01/anat/sub-01_ses-01_label-acuteinfarct_method-snm_atlas-schaefer2018parcels100networks7_desc-intactconnectivitymatrix_connmatrix.tsv
/tmp/outputs_snm_run2/sub-01/ses-01/anat/sub-01_ses-01_label-acuteinfarct_method-snm_atlas-schaefer2018parcels100networks7_desc-maskconnectivitymatrix_connmatrix.json
/tmp/outputs_snm_run2/sub-01/ses-01/anat/sub-01_ses-01_label-acuteinfarct_method-snm_atlas-schaefer2018parcels100networks7_desc-maskconnectivitymatrix_connmatrix.tsv
/tmp/outputs_snm_run2/sub-01/ses-01/anat/sub-01_ses-01_label-acuteinfarct_method-snm_atlas-schaefer2018parcels100networks7_desc-matrixstatistics_stats.json
Visualize the disconnectivity of the visual network. Because dTOR985 is mainly consisting of long fiber bundles the sparsity of the matrix is expected.
import pandas as pd
import numpy as np
import matplotlib.pyplot as plt

file_path = "/tmp/outputs_snm_run2/sub-01/ses-01/anat/sub-01_ses-01_label-acuteinfarct_method-snm_atlas-schaefer2018parcels100networks7_desc-disconnectionpct_connmatrix.tsv"
mat = pd.read_csv(file_path, sep="\t", header=0, index_col=0)

visual_network_regions = [parc for parc in mat.index if "Vis" in parc]
mat = mat.loc[visual_network_regions, visual_network_regions]
mat = mat.values

plt.figure(figsize=(10, 8))
im = plt.imshow(mat, aspect='auto')
plt.colorbar(im, label="Disconnectivity (%)")

plt.title("Disconnectivity matrix of visual network (Schaefer100x7)")
plt.xlabel("Region")
plt.ylabel("Region")

im.set_clim(0, 100)

plt.tight_layout()
plt.show()

Visualize the parcel-level disconnection (%) on the cortical surface with yabplot
import warnings
import pyvista as pv
import yabplot as yab

warnings.simplefilter("ignore", pv.PyVistaDeprecationWarning)

pv.set_jupyter_backend('static')
pv.global_theme.notebook = True
pv.start_xvfb()

file_path = "/tmp/outputs_snm_run2/sub-01/ses-01/anat/sub-01_ses-01_label-acuteinfarct_method-snm_atlas-schaefer2018parcels100networks7_desc-disconnectionpct_parcelstats.tsv"

df = pd.read_csv(file_path, sep="\t", index_col=0)
values = df.values.flatten()

yab.plot_cortical(
    data=values,
    atlas='schaefer100',
    views=['left_lateral', 'left_medial', 'right_lateral', 'right_medial'],
    figsize=(800, 300),
    vminmax=(0,10),
    cmap="Reds",
    display_type="static",
)

Run structural network mapping on multiple subjects
Lacuna supports processing multiple subjects within a single run. If the --participant-label flag is omitted, the analysis is automatically executed for all subjects detected in the BIDS dataset. With the --verbose we can see which masks are detected.
Execution strategies are optimized internally for each analysis type. For structural network mapping, subjects are processed sequentially. Parallelizing across subjects is intentionally avoided, as concurrent processes would repeatedly access the same tractogram file, leading to race conditions and degraded performance.
Instead, parallelism is implemented at the single-subject level via multithreading, controlled by the --nprocs parameter.
!lacuna run snm \
    /tmp/tutorial_bids/ \
    /tmp/outputs_snm_run3/ \
    --connectome-path /tmp/dtor985_10pct_data/dtor985_10pct.tck \
    --mask-space MNI152NLin6Asym \
    --compute-roi-disconnection \
    --parcel-atlases schaefer2018parcels100networks7 \
    --nprocs 12 \
    --verbose
List the parcel-level outputs for multiple subjects
!ls /tmp/outputs_snm_run3/sub-*/*/*/sub-*_ses-01_label-acuteinfarct_method-snm_atlas-schaefer2018parcels100networks7_desc-disconnectionpct_parcelstats.tsv
/tmp/outputs_snm_run3/sub-01/ses-01/anat/sub-01_ses-01_label-acuteinfarct_method-snm_atlas-schaefer2018parcels100networks7_desc-disconnectionpct_parcelstats.tsv
/tmp/outputs_snm_run3/sub-02/ses-01/anat/sub-02_ses-01_label-acuteinfarct_method-snm_atlas-schaefer2018parcels100networks7_desc-disconnectionpct_parcelstats.tsv
/tmp/outputs_snm_run3/sub-03/ses-01/anat/sub-03_ses-01_label-acuteinfarct_method-snm_atlas-schaefer2018parcels100networks7_desc-disconnectionpct_parcelstats.tsv
Collect parcel-level outputs into a single tsv
!lacuna collect \
    /tmp/outputs_snm_run3/ \
    --pattern "*disconnectionpct*" \
    --output-dir /tmp/group_outputs_snm/ \
    --verbose
2026-06-12 12:21:46 - lacuna.cli.main - INFO - Running collect (group-level aggregation)
2026-06-12 12:21:46 - lacuna.cli.main - INFO - Scanning derivatives directory: /tmp/outputs_snm_run3
2026-06-12 12:21:46 - lacuna.cli.main - INFO - Output directory: /tmp/group_outputs_snm
2026-06-12 12:21:46 - lacuna.cli.main - INFO - Pattern: *disconnectionpct*_parcelstats.tsv
2026-06-12 12:21:46 - lacuna.cli.main - INFO - Found 3 file(s) across 3 subject(s) and 1 output type(s)
Collecting output types:   0%|                          | 0/1 [00:00<?, ?type/s]
  Reading ses-01_label-acuteinfarct_method-snm_atlas-schaefer2018parcels100netwo
Collecting output types: 100%|██████████████████| 1/1 [00:00<00:00, 36.47type/s]
2026-06-12 12:21:46 - lacuna.cli.main - INFO - Created 1 group-level TSV file(s):
2026-06-12 12:21:46 - lacuna.cli.main - INFO -   - group_ses-01_label-acuteinfarct_method-snm_atlas-schaefer2018parcels100networks7_desc-disconnectionpct_parcelstats.tsv
!ls /tmp/group_outputs_snm/*disconnectionpct*
/tmp/group_outputs_snm/group_ses-01_label-acuteinfarct_method-snm_atlas-schaefer2018parcels100networks7_desc-disconnectionpct_parcelstats.json
/tmp/group_outputs_snm/group_ses-01_label-acuteinfarct_method-snm_atlas-schaefer2018parcels100networks7_desc-disconnectionpct_parcelstats.tsv
parcel_df = pd.read_csv("/tmp/group_outputs_snm/group_ses-01_label-acuteinfarct_method-snm_atlas-schaefer2018parcels100networks7_desc-disconnectionpct_parcelstats.tsv", sep="\t", index_col=0)
parcel_df
| session_id | label | 7Networks_LH_Vis_1 | 7Networks_LH_Vis_2 | 7Networks_LH_Vis_3 | 7Networks_LH_Vis_4 | 7Networks_LH_Vis_5 | 7Networks_LH_Vis_6 | 7Networks_LH_Vis_7 | 7Networks_LH_Vis_8 | ... | 7Networks_RH_Default_Temp_1 | 7Networks_RH_Default_Temp_2 | 7Networks_RH_Default_Temp_3 | 7Networks_RH_Default_PFCv_1 | 7Networks_RH_Default_PFCv_2 | 7Networks_RH_Default_PFCdPFCm_1 | 7Networks_RH_Default_PFCdPFCm_2 | 7Networks_RH_Default_PFCdPFCm_3 | 7Networks_RH_Default_pCunPCC_1 | 7Networks_RH_Default_pCunPCC_2 | |
|---|---|---|---|---|---|---|---|---|---|---|---|---|---|---|---|---|---|---|---|---|---|
| participant_id | |||||||||||||||||||||
| 1 | 1 | acuteinfarct | 0.016247 | 0.077709 | 0.233209 | 1.749715 | 3.693629 | 2.481182 | 0.0 | 3.935833 | ... | 0.507505 | 3.757325 | 0.575590 | 0.539811 | 0.000000 | 0.067381 | 0.014714 | 0.000000 | 5.475963 | 0.521447 |
| 2 | 1 | acuteinfarct | 0.000000 | 0.000000 | 0.000000 | 0.000000 | 0.000000 | 0.000000 | 0.0 | 0.000000 | ... | 0.000000 | 0.000000 | 0.000000 | 0.000000 | 0.000000 | 0.000000 | 0.000000 | 0.000000 | 0.000000 | 0.000000 |
| 3 | 1 | acuteinfarct | 0.016247 | 0.000000 | 0.000000 | 0.000000 | 0.000000 | 0.000000 | 0.0 | 0.012435 | ... | 13.270705 | 18.717684 | 26.676847 | 0.202429 | 0.229387 | 0.000000 | 0.011035 | 0.018963 | 0.366125 | 0.016821 |
3 rows × 102 columns